
A Couple of Points on Straight Line Graphs...
- Jul 1, 2022
- 2 min read
Here we look at a great way to construct/sketch a straight line graph that requires just two points.
The two-point gradient and y-intercept method
The equation for a straight line is

Where x and y are variables that relate to the x and y axes of a graph.
The gradient (slope) of the line is given by m - this is the number immediately before the x (it's known as the coefficient). If the coefficient is a negative value, the gradient will slope downwards on a graph.
The c term is the y-intercept - the point on the y-axis where the line will cross.
Look at the following equation...

If it can be manipulated so that it has the form y = mx + c, it can be graphed.

In this case, the line will have a gradient of 3 and will cross the y-axis at y = 4.
The line can be graphed quickly by plotting just two points.
The easiest point to plot is the y-intercept. This occurs when x = 0 so the coordinates will be (0, 4)

Another point on the graph is needed and it can be found using the value for the gradient, 3.
The gradient is usually found by calculating...
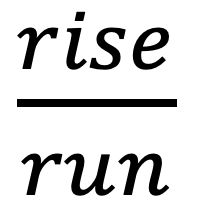
...the change in y divided by the change in x for 2 points on a line.
Looking at the equation, this is already done. The value 3 can be represented as .
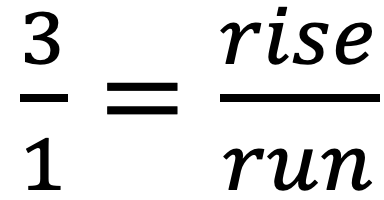
This just means that for every unit increase in a value for x, there will be 3-fold unit increase in the value of y.
Starting with the y-intercept coordinate, move 1 place along the x-axis and 3 places up the y-axis, to get a second coordinate as follows:
The x value will move from 0 to 1 and the y value will move from 4 to 7 (increasing by 3). The new coordinate will be (1, 7).

Complete by lining up a straight edge to the two coordinates and pencil in the line. This line represents the equation and can be read off to find the corresponding values for the variables x and y.

The x-intercept
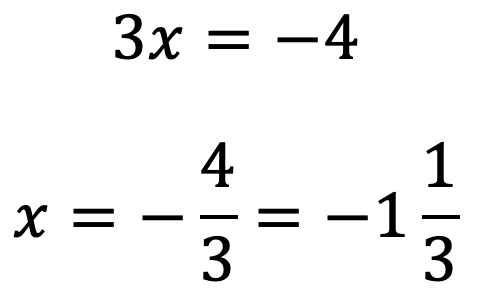
The point where the line crosses the x-axis can also be found from the equation...
Set the y value to 0 (the value for y when the value for x lies directly on the x-axis)...

Make x the subject...
Summary
Find and plot the y-intercept from the equation for a straight line
Use the coefficient of x to find a second point on the graph
Line up the points and draw a straight line!
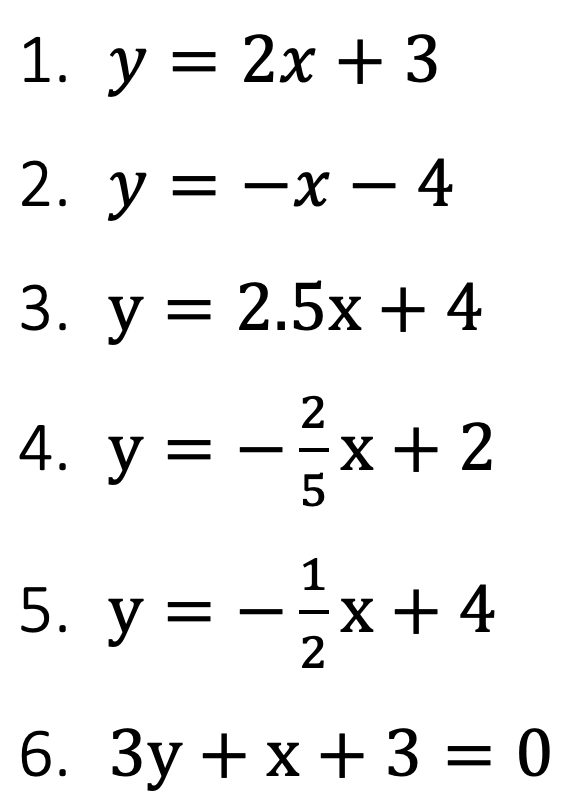
Have a go at plotting the following. You can construct your own graphs or use the Graphing Blank provided below.
Graph paper
Here are the solutions
Comments & likes always welcome!


Comments